

Introduction
Hello! This is one of the capstone projects that I completed for the Google Data Analytics Professional Certificate. In this case study, I primarily used SQL for cleaning and analyzing my data, with minor cleaning done in Excel before importing to Bigquery, and then used Tableau for the visualizations.
Scenario
You are a junior data analyst working on the marketing analyst team at Bellabeat, a high-tech manufacturer of health-focused products for women. Bellabeat is a successful small company, but they have the potential to become a larger player in the global smart device market. Urška Sršen, cofounder and Chief Creative Officer of Bellabeat, believes that analyzing smart device fitness data could help unlock new growth opportunities for the company. You have been asked to focus on one of Bellabeat’s products and analyze smart device data to gain insight into how consumers are using their smart devices. The insights you discover will then help guide marketing strategy for the company. You will present your analysis to the Bellabeat executive team along with your high-level recommendations for Bellabeat’s marketing strategy.
Ask
Business Task -
The task at hand is to analyze non-Bellabeat smart products to gain insights into where Bellabeat can expand to provide more for our customers.
Key Stakeholders-
Urška Sršen - co-founder and Chief Creative Officer
Sando Mur - co-founder & key member of the Bellabeat executive team
Marketing Analytics Team
Products -
Bellabeat app - The Bellabeat app provides users with health data related to their activity, sleep, stress, menstrual cycle, and mindfulness habits.
Leaf - Bellabeat’s classic wellness tracker can be worn as a bracelet, necklace, or clip.
Time - Wellness watch with smart technology to track user activity, sleep, and stress.
Spring - This is a water bottle that tracks daily water intake.
Prepare
Description of all data sources used
The data sources come from the included dataset provided with the case study which is third-party data originating from Mobius (https://www.kaggle.com/datasets/arashnic/fitbit) and is dated from April 2016 to May 2016. The dataset is public with a CCO 1.0 license, waiving copyright interests. As for privacy and security, all personal or traceable information has been removed and is not included with the dataset protecting those that provided the data, and since this dataset is public it is accessible to anybody.
After viewing data in excel I noticed that many of the files had already been condensed into one file which was “daily_activity_merged” and decided to use this file along with the “sleepday_merged” and “weightloginfo_merged” files as they were not included with the daily activity file.
Also, it was obvious that this data did not meet the ROCCC requirements and would not be a viable source to make business decisions from. In reality, as a data analyst, I would refer to the stakeholders about this issue and see if there are any other datasets available within the company as well as outside to contribute towards analysis. Since this is a case study to demonstrate what I have learned through the course I proceeded with this data and used it for the case study. Primary CSV’s that were looked into and used were “Daily Activity”, “Daily Sleep”, and “Weight Log”.
ROCC
Reliable - Low. Datasets were extremely small with around 30 participants included in the datasets.
Original - Low. Data is from a 3rd party source and no in-house/1st party data was provided from our products.
Comprehensive - Medium. Data contains many useful data points for analysis such as fates, activity, distance, calories, sleep, etc., but does leave out information like age and gender.
Current - Low. Data is not current (6 years old) and should not be used for analysis.
Cited - Low. Data came from a third-party source and have no information whether this is a credible source.
Process
Documentation of any cleaning or manipulation of data.
For this case study, BigQuery SQL was primarily used in cleaning and preparing the datasets.
/*
## = Section Labels (I used these to separate/organize my work keeping commands with their respective tables when cleaning and to divide cleaning tasks and analysis)
/* = Work Done (Used these to give a brief explanation of work done and comes after the command)
*/
## CLEANING DATA IN SQL
ALTER TABLE smart_device_data.daily_activity
RENAME COLUMN ActivityDate TO Date;
ALTER TABLE smart_device_data.daily_sleep
RENAME COLUMN SleepDay TO Date;
/* renaming tables date name to "date" across all tables */
## CLEANING DAILY ACTIVITY TABLE
SELECT
MAX(TotalSteps),
AVG(TotalSteps),
MIN(TotalSteps)
FROM
`bellabeat-case-study-365218.smart_device_data.daily_activity`;
/* looking for outliers in total steps. The idea being that if abnormally low or 0 steps taken would likely mean that fitbit was not worn for that day and data should be removed */
SELECT
TotalSteps
FROM
`bellabeat-case-study-365218.smart_device_data.daily_activity`
ORDER BY
1 ASC;
SELECT
COUNT(TotalSteps)
FROM
`bellabeat-case-study-365218.smart_device_data.daily_activity`
WHERE
TotalSteps = 0;
/* using this to take a closer look at how many 0 step counts*/
DELETE
FROM
`bellabeat-case-study-365218.smart_device_data.daily_activity`
WHERE
TotalSteps = 0;
/*deleting rows with 0 steps as these will be considered as a day where fitbit was not worn */
SELECT
MAX(SedentaryMinutes)/60 AS s_hours,
MAX(LightlyActiveMinutes)/60 AS la_hours,
MAX(FairlyActiveMinutes)/60 AS fa_hours,
MAX(VeryActiveMinutes)/60 AS va_hours
FROM
`bellabeat-case-study-365218.smart_device_data.daily_activity`;
/* now looking at more outliers in the minutes active columns from this we see that there are outliers in the minutes spent (which we converted to hours in the query) sedentary. For this we will want to remove rows containing 24 hours and take a closer look to see if there are more within this column*/
DELETE
FROM
`bellabeat-case-study-365218.smart_device_data.daily_activity`
WHERE
SedentaryMinutes = 1440;
/* 7 rows removed*/
SELECT
*
FROM
`bellabeat-case-study-365218.smart_device_data.daily_activity`
WHERE
TotalSteps < 100
ORDER BY
TotalSteps,
SedentaryMinutes;
DELETE
FROM
`bellabeat-case-study-365218.smart_device_data.daily_activity`
WHERE
TotalSteps < 100;
/* revisited Total Steps Column: after viewing data rows with less than 100 steps and high sedentary minutes these contained outliers in other sections of the rows (ex: 0's or very low numbers in all columns) and have been removed. This removed 10 rows.*/
UPDATE `bellabeat-case-study-365218.smart_device_data.daily_activity`
SET
TotalDistance = ROUND(TotalDistance,4),
TrackerDistance = ROUND(TrackerDistance,4),
VeryActiveDistance = ROUND(VeryActiveDistance,4),
ModeratelyActiveDistance = ROUND(ModeratelyActiveDistance,4),
LightActiveDistance = ROUND(LightActiveDistance,4),
SedentaryActiveDistance = ROUND(SedentaryActiveDistance,4)
WHERE
TotalDistance > 0;
/* updated table and rounded these distances extended past 10 decimal places. With a rounding to 4 decimal places measurements will still be extremely accurate in either Miles or Kilometers. 4 decimal places: 0.0001 Mi = 6.3 inches, 0.0001 Km = 10 Cm. */
UPDATE `bellabeat-case-study-365218.smart_device_data.daily_activity`
SET
TotalMinutesActive = VeryActiveMinutes+FairlyActiveMinutes+LightlyActiveMinutes+SedentaryMinutes
WHERE
TotalMinutesActive IS NULL;
/* Added TotalMinutesActive column through editing schema and then updated new column to reflect sum of all minute columns to use later in analysis*/
## CLEANING WEIGHT LOG TABLE
UPDATE `bellabeat-case-study-365218.smart_device_data.weight_log`
SET
Fat = 0
WHERE
Fat IS NULL;
/* changed NULL in columns to 0 for analysis*/
UPDATE `bellabeat-case-study-365218.smart_device_data.weight_log`
SET
WeightKg = round(WeightKg, 2),
WeightPounds = round(WeightPounds, 2)
WHERE
WeightKg > 1;
/* Updated table to round Weight Kg and Pound columns to 2 decimal places */
SELECT
WeightKg,
WeightPounds
FROM
`bellabeat-case-study-365218.smart_device_data.weight_log`;
/* Verifying that changes are correct */
## CLEANING DAILY SLEEP TABLE
/*no cleaning required of this table*/
Analyze
A summary of your analysis
For analysis, BigQuery SQL was also used. Pictures are the results of the query that was run (most pictures do not contain all results just the first 10 or fewer rows).
## ANALYSIS
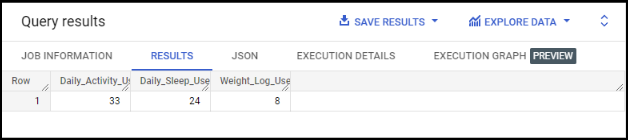
SELECT
COUNT(DISTINCT da.Id) AS Daily_Activity_Users,
COUNT(DISTINCT ds.Id) AS Daily_Sleep_Users,
COUNT(DISTINCT wl.Id) AS Weight_Log_Users
FROM
`bellabeat-case-study-365218.smart_device_data.daily_activity` AS da
FULL JOIN `bellabeat-case-study-365218.smart_device_data.daily_sleep` AS ds
ON da.Id = ds.Id
FULL JOIN `bellabeat-case-study-365218.smart_device_data.weight_log` AS wl
ON da.Id = wl.Id;
/* when looking at the number of users for each table we see that there are varying numbers of users across these datasets, showing that not all users logged all areas of information*/
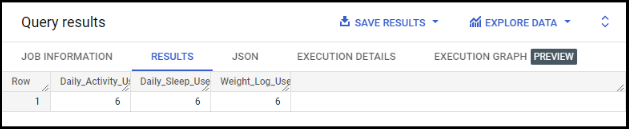
SELECT
COUNT(DISTINCT da.Id) AS Daily_Activity_Users,
COUNT(DISTINCT ds.Id) AS Daily_Sleep_Users,
COUNT(DISTINCT wl.Id) AS Weight_Log_Users
FROM
`bellabeat-case-study-365218.smart_device_data.daily_activity` AS da
INNER JOIN `bellabeat-case-study-365218.smart_device_data.daily_sleep` AS ds
ON da.Id = ds.Id
INNER JOIN `bellabeat-case-study-365218.smart_device_data.weight_log` AS wl
ON da.Id = wl.Id;
/* this query shows us that only 6 users (18% of users) in total recorded data across all tables presented in the study*/
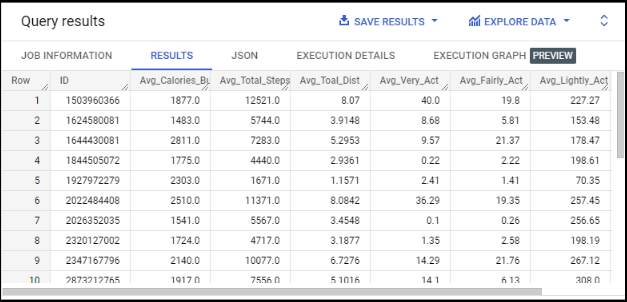
SELECT
DISTINCT Id AS ID,
ROUND(AVG(Calories)) AS Avg_Calories_Burned,
ROUND(AVG(TotalSteps)) AS Avg_Total_Steps,
ROUND(AVG(TotalDistance),4) AS Avg_Toal_Dist,
ROUND(AVG(VeryActiveMinutes),2) AS Avg_Very_Act,
ROUND(AVG(FairlyActiveMinutes),2) AS Avg_Fairly_Act,
ROUND(AVG(LightlyActiveMinutes),2) AS Avg_Lightly_Act,
ROUND(AVG(SedentaryMinutes),2) AS Sedentary
FROM
`bellabeat-case-study-365218.smart_device_data.daily_activity`
GROUP BY
1
ORDER BY
1;
/* this query shows us each user’s avgerage recorded data which can be saved as table exported and used for visualizations to compare avg steps to calories, most active days, etc.*/
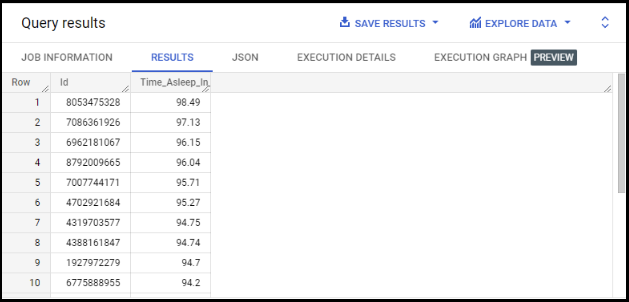
SELECT
DISTINCT Id,
ROUND(AVG(TotalMinutesAsleep/TotalTimeInBed)*100,2) AS Time_Asleep_In_Bed
FROM
`bellabeat-case-study-365218.smart_device_data.daily_sleep`
GROUP BY
1
ORDER BY
2 DESC;
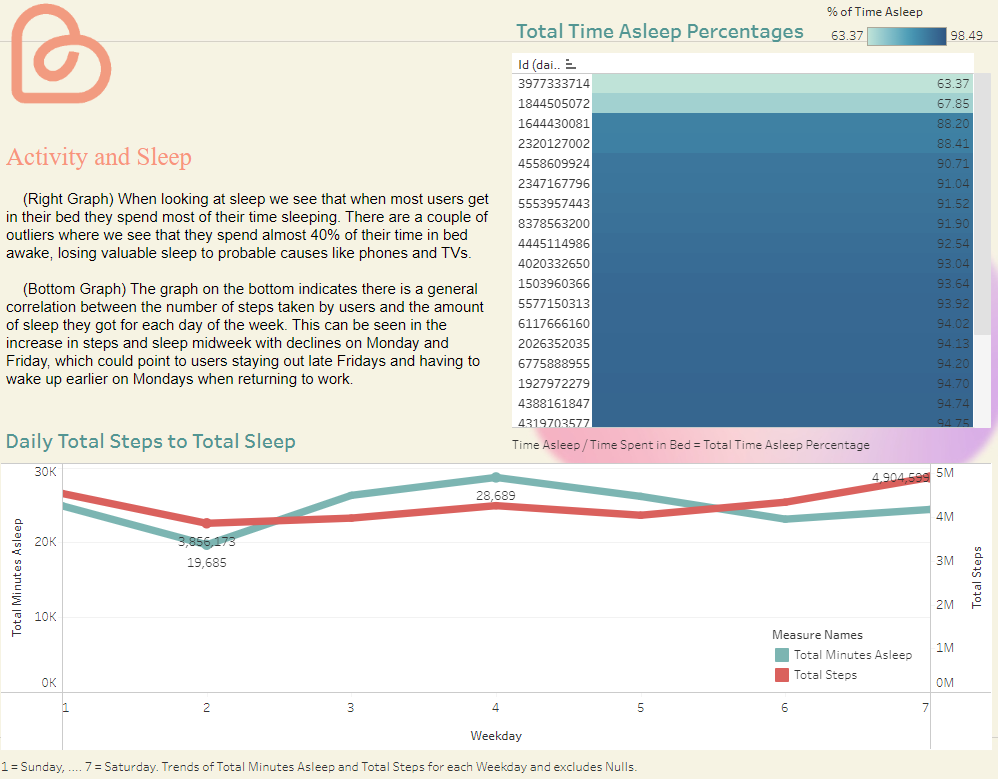
/* this shows the percentage of time asleep when in bed where on the low end some users are spending around 40% of their time in bed awake*/
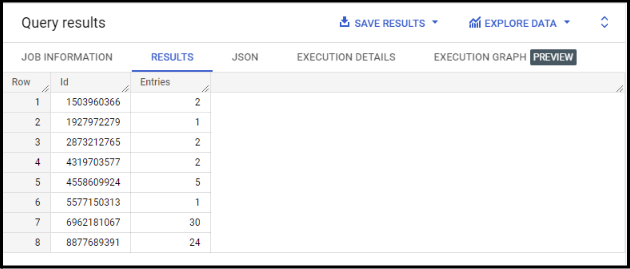
SELECT
DISTINCT Id AS Id,
COUNT(LogId) AS Entries
FROM
`bellabeat-case-study-365218.smart_device_data.weight_log`
GROUP BY
Id
ORDER BY
Id ASC;
/* when looking at the weight log users and number of entries we see that an extremely low amount of people partook in this and only 2 out of the 6 logged data for more than 5 days*/
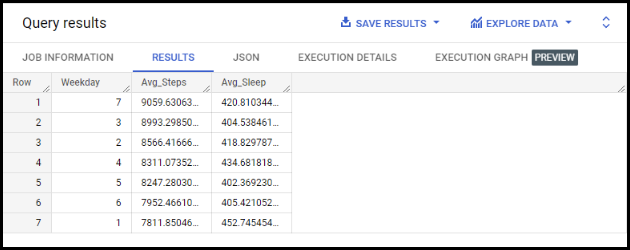
SELECT
ds.Weekday,
AVG(TotalSteps) AS Avg_Steps,
AVG(TotalMinutesAsleep) AS Avg_Sleep
FROM
`bellabeat-case-study-365218.smart_device_data.daily_sleep` AS ds
JOIN `bellabeat-case-study-365218.smart_device_data.daily_activity` AS da
ON ds.Weekday = da.Weekday
GROUP BY
1
ORDER BY
2 DESC;
/* shows avg steps compared to sleep and with visualization that we will plug into tableau*/
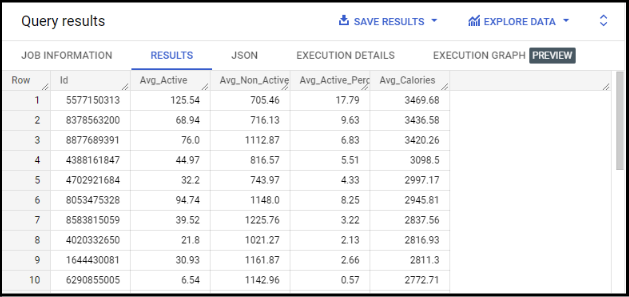
SELECT
DISTINCT Id,
ROUND(AVG(VeryActiveMinutes+FairlyActiveMinutes),2) AS Avg_Active,
ROUND(AVG(SedentaryMinutes),2) AS Avg_Non_Active,
ROUND((AVG(VeryActiveMinutes+FairlyActiveMinutes)/AVG(SedentaryMinutes))*100,2) AS Avg_Active_Percentage,
ROUND(AVG(Calories),2) AS Avg_Calories
FROM
`bellabeat-case-study-365218.smart_device_data.daily_activity`
GROUP BY
1
ORDER BY
5 DESC;
/*shows avg minutes active (with very and fairly active minutes) compared to avg calories burned*/
Share
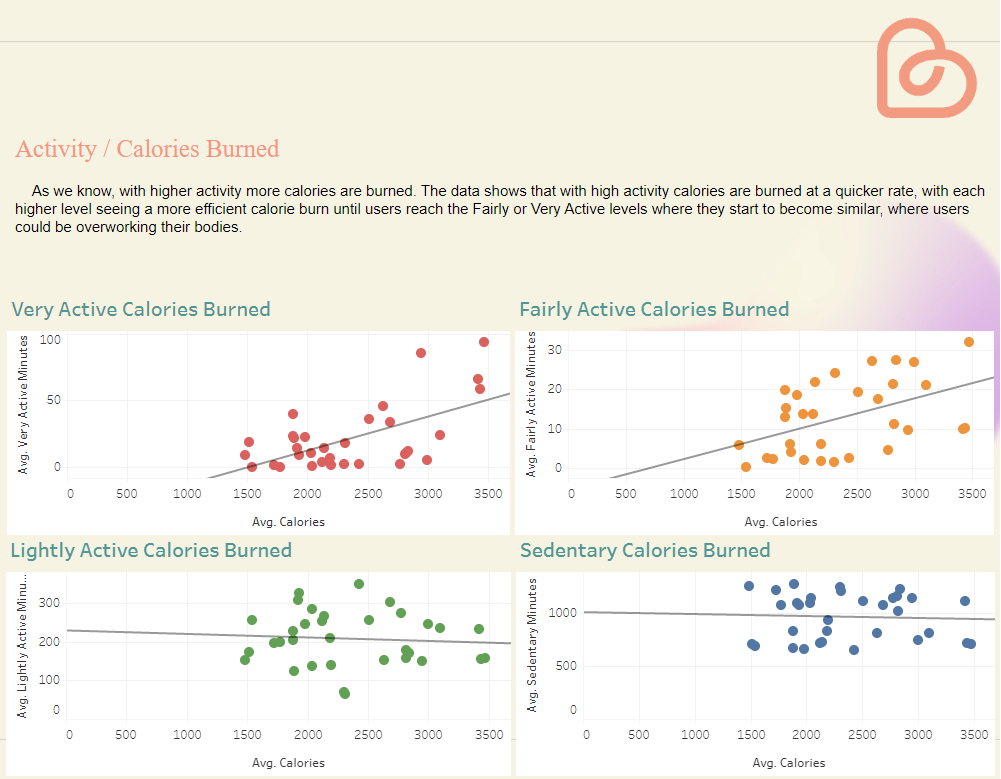
Visualizations and key findings
For full Tableau visualization copy and paste the link or click the button below!
(https://public.tableau.com/views/BellabeatCaseStudy_16696703938140/Story1?:language=en-US&:display_count=n&:origin=viz_share_link
Act
Insights based on your analysis
Recommendations
Expand our datasets by collecting data through our own products. The following added features to the Bellabeat app could boost product engagement and draw in more customers to our product ecosystem.
General - Streamline the app to make it easier to input and record users' data (i.e. automatically record health data in app for user) to boost user engagement and take full advantage of all the app’s abilities.
Activity & Calories - Tailored workout plans via the Bellabeat app to help find optimal activity/calorie burn for users, which not only would help prevent overexertion but also help new gym goers.
Sleep - Implement app features to remind users of bedtime and alert users when they are not getting enough sleep. This would help create routines for users as well as help the few outliers we saw earlier spend more time getting their needed sleep.
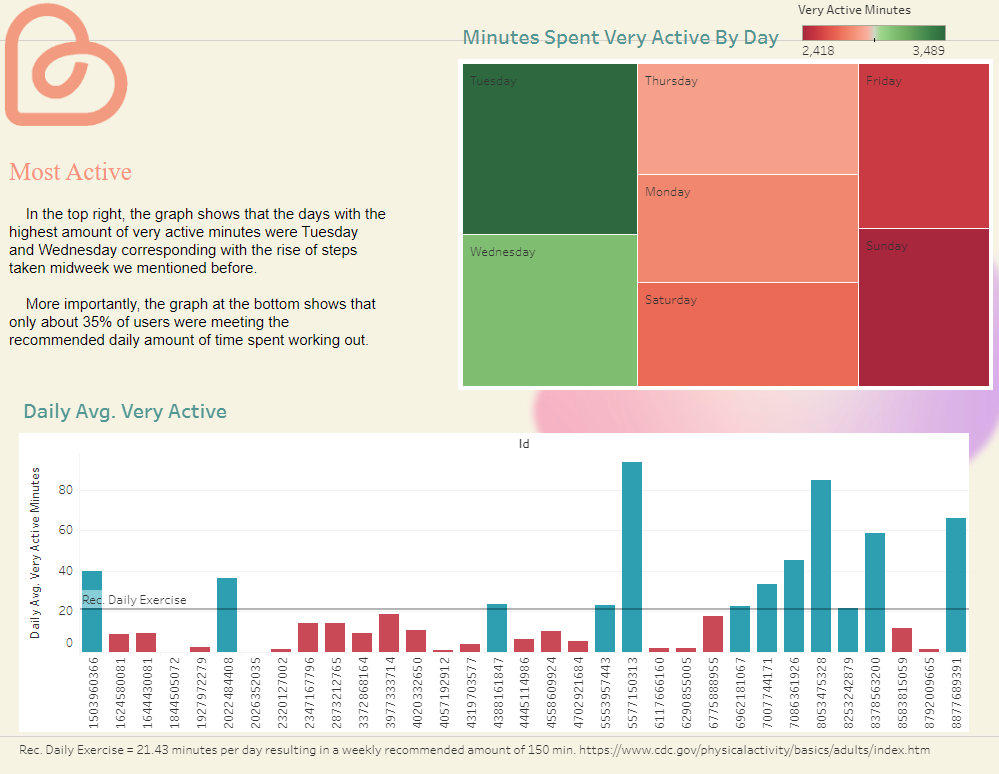
General Activity - Implement app features that allow users to interact with the app to see what days they are most active as well as implement features to alert users to get up and move around if they are not meeting their daily activity goals, improving the number of people not meeting the recommended daily activity time.
Wrap up
With these recommendations focusing on the Bellabeat app, the company could gear its marketing campaign towards awareness for the app and its newly implemented features that should boost engagement within the existing customer base. Along with this the app and its features would be on par with competitor apps drawing in more potential customers that future marketing campaigns can take advantage of and secure.
Thank You for taking the time to go through my case study!
-Harrison Arthur