

Introduction
Hello! This is one of the capstone projects I completed to finish off my course in Google's Data Analytics Professional Certificate. In this case study, I primarily used R for cleaning and analyzing my data, with a little cleaning done in Excel before importing it into RStudio. I also wanted to test out and play around with R's visualization capabilities so for this case study, all visualizations will be done with ggplot2. As a final note before you get into the case study I will provide a button below that will take you to my Kaggle if you would wish to see a more streamlined version there!
Scenario
You are a junior data analyst working in the marketing analyst team at Cyclistic, a bike-share company in Chicago. The director of marketing believes the company’s future success depends on maximizing the number of annual memberships. Therefore, your team wants to understand how casual riders and annual members use Cyclistic bikes differently. From these insights, your team will design a new marketing strategy to convert casual riders into annual members. But first, Cyclistic executives must approve your recommendations, so they must be backed up with compelling data insights and professional data visualizations.
Ask
Business Task -
The task at hand is to analyze Cyclistic’s data to find differences in the use of between casuals and members to see where the company can convert more users over to annual memberships.
Key Stakeholders-
Lily Moreno - marketing director and my manager
Cyclistic Executive Team - deciding team to approve recommended marketing program
Marketing Analytics Team
Prepare
Description of all data sources used
The data sources come from the included dataset provided with the case study. Since Cyclistic is a fictional company, the dataset used will be considered first-party/in-house data, as the scenario pointed out. Looking at privacy and security, users' personal information is not included, and since this is first-party data from our company I would assume that the original data is secure and safe within the company’s servers.
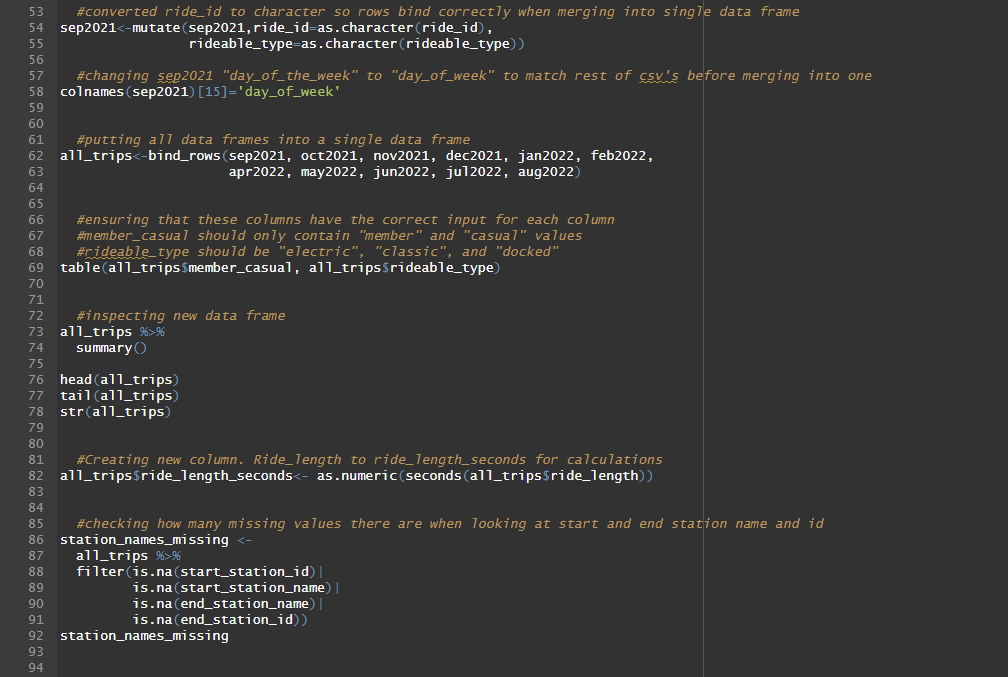
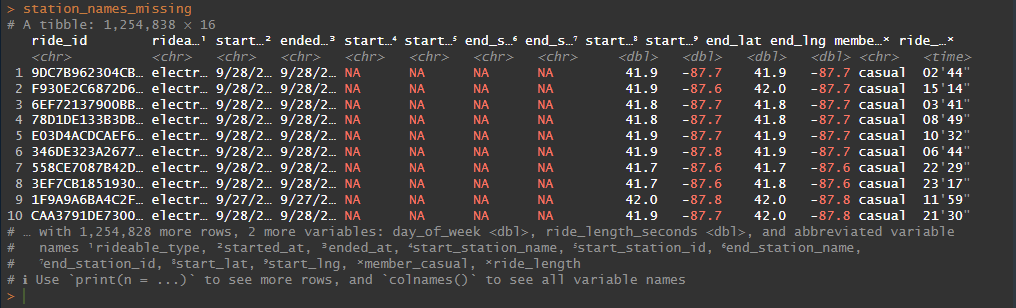
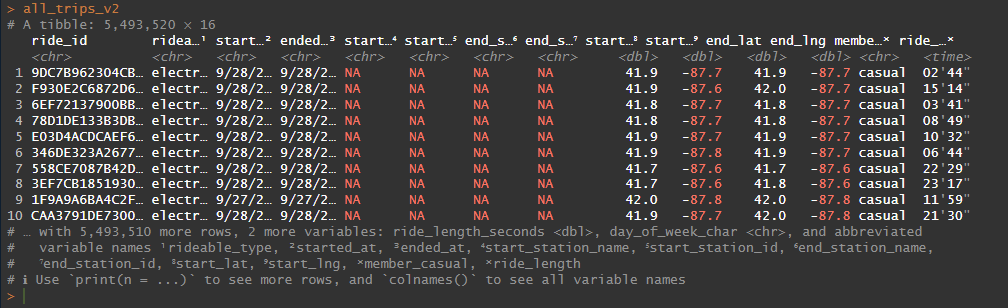
On initial inspection, there were good signs with all files being organized, following a YYYYMM naming convention, and can be considered recent data(within the past two years). Though after a quick look through I noticed that there were a lot (over 1 million observations) of missing data in the start and end “station name” columns, as well as the start and end “station id” columns. The best course of action would be to ask stakeholders about missing data to get a better understanding of why this data is missing and potentially retrieve this data, as we could see which stations were most popular between groups, but since this is a case study I must assume that this data is not retrievable and must work with what I have.
ROCCC
Reliable - High. With all data combined, we have millions of observations recorded with 16 variables for each of these observations.
Original - High. This is original data as it is first-party data.
Comprehensive - Medium. Data contains useful points like types of bikes used and ride length among others, but does leave out crucial information about start and end locations preventing us to see which stations are most used by which group, and which areas we could target ads.
Current - High. Data is recent as it comes from this year (2022) as well as last year. (Sep. 2021 - Aug .2022)
Cited - High. First-Party/In-House data on our own customers that we are analyzing.
Process
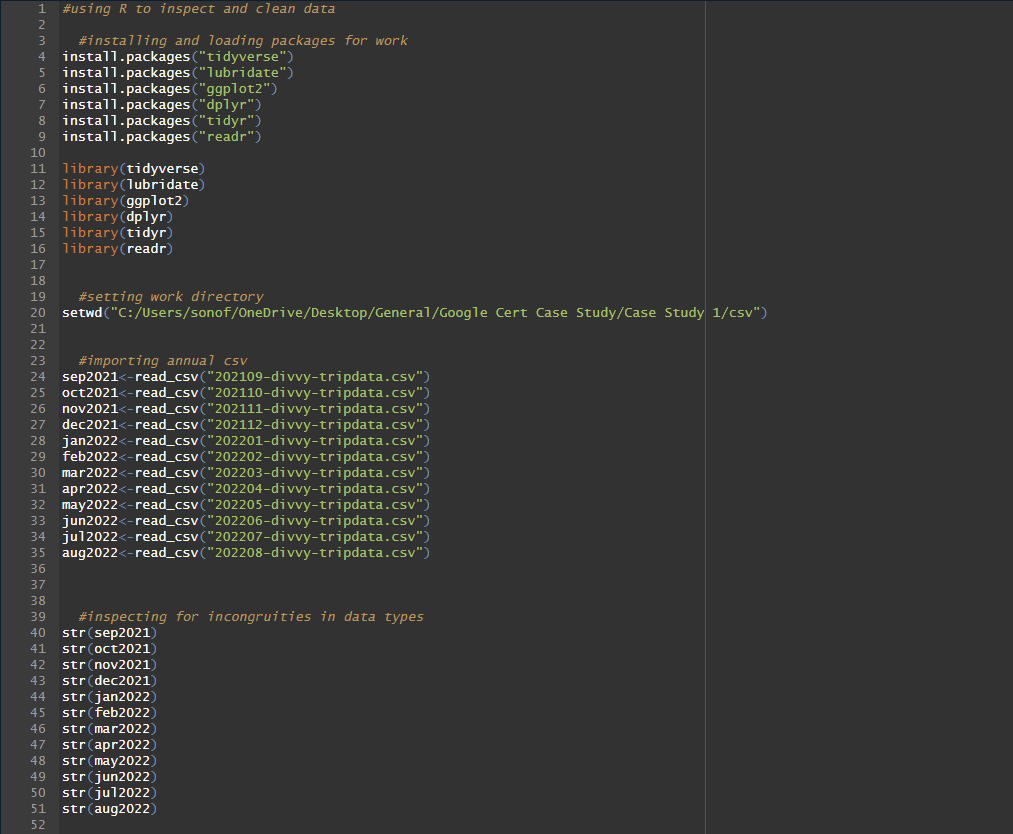
Documentation of any cleaning or manipulation of data.
For this case study both Excel and RStudio were used in cleaning and preparing the datasets.
____________________________________________________________________________________


_______________________________________________________________________
Analyze
A summary of your analysis
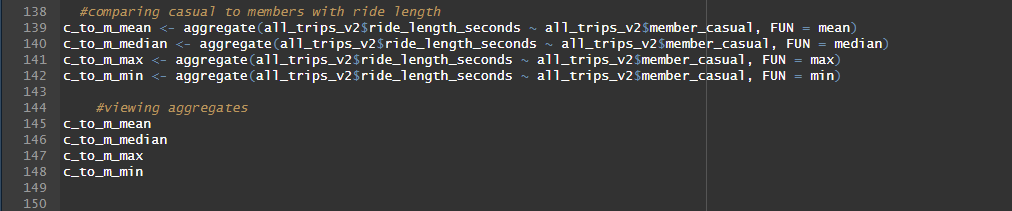
Continuing with RStudio for analysis
_______________________________________________________________________


_______________________________________________________________________
Share
Visualizations and key findings
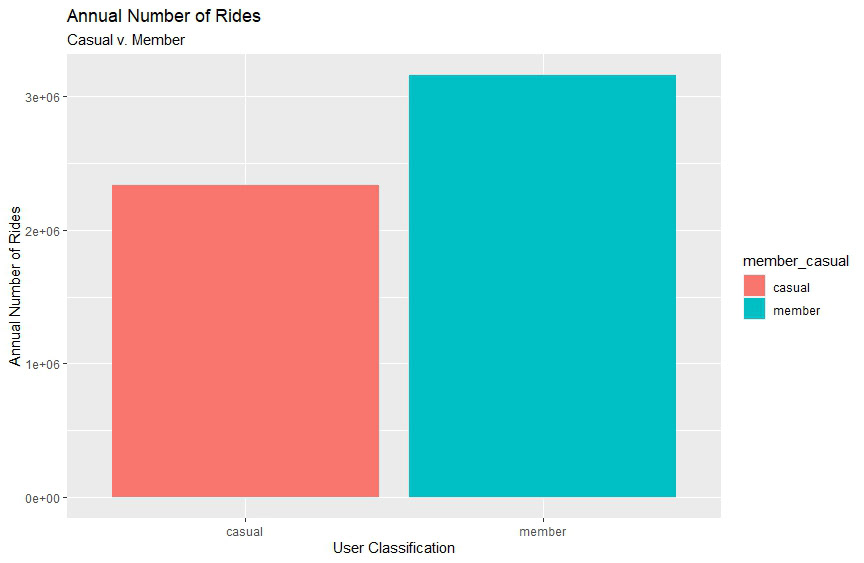
This viz shows us that based on the past year's ride numbers members are taking more trips than casuals.

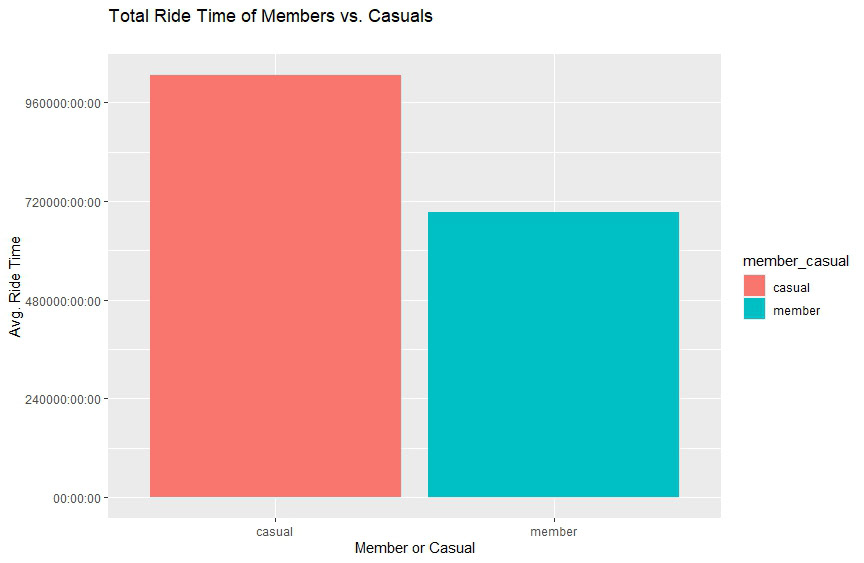
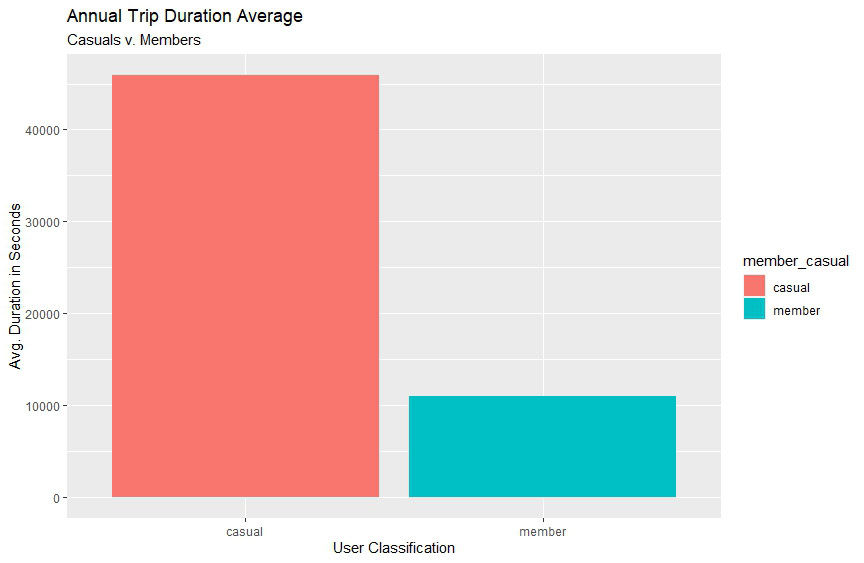
These next two graphs shows us that within the past year even though casuals are taking fewer trips than members, casuals have spent much more time riding in total as well as on average when compared to members.


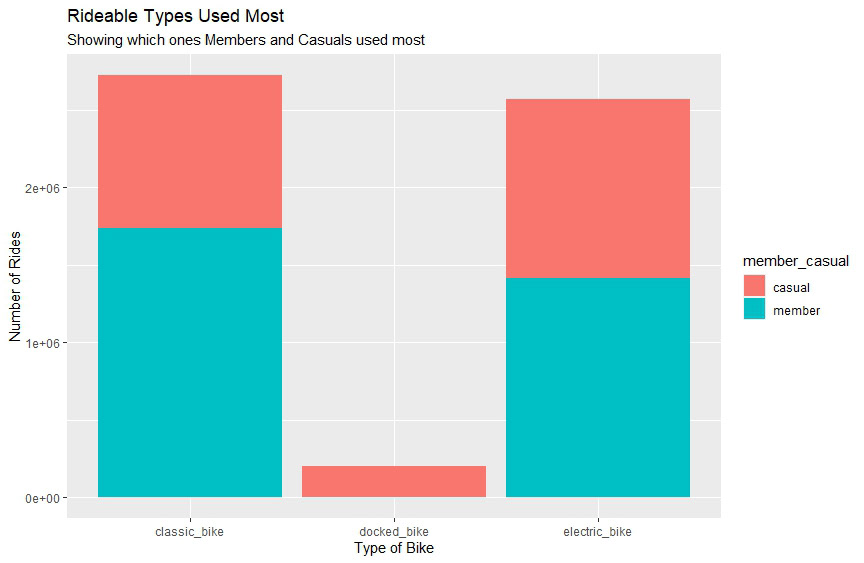
Now looking at which types of bikes were preferred by each group of users, we see that the majority of casual riders preferred electric bikes and were also the sole users of docked bikes. As for members, the majority preferred to ride classic bikes.

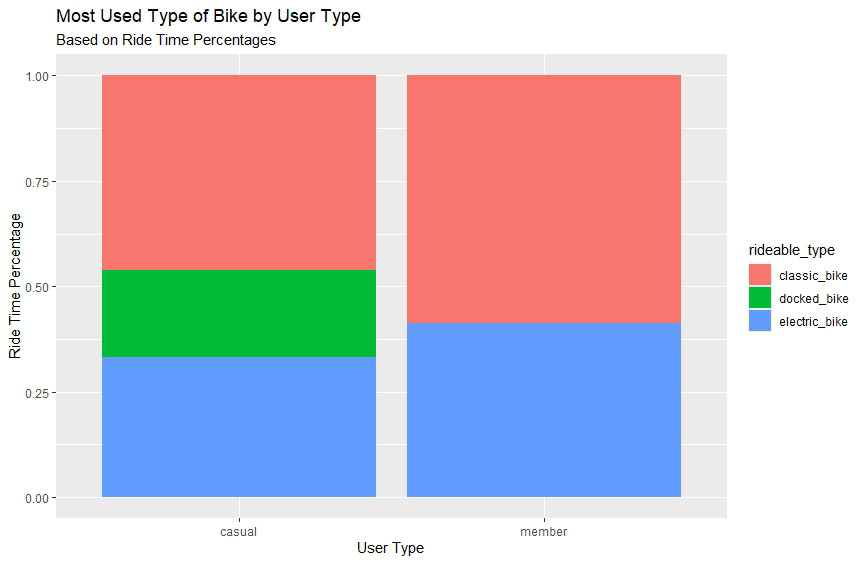
We just looked at which bikes were most popular by the number of trips, but now we will look at which types of bikes were used the longest based on ride duration. In this case, even though we saw casuals take more trips with electric bikes their trip durations with these bikes are shorter compared to when riding a classic bike, with docked bikes remaining as the smaller segment and accounting for about 20% of time riding. Members on the other hand tend to ride their preferred bikes (classic bikes as we saw in the last viz) the longest.

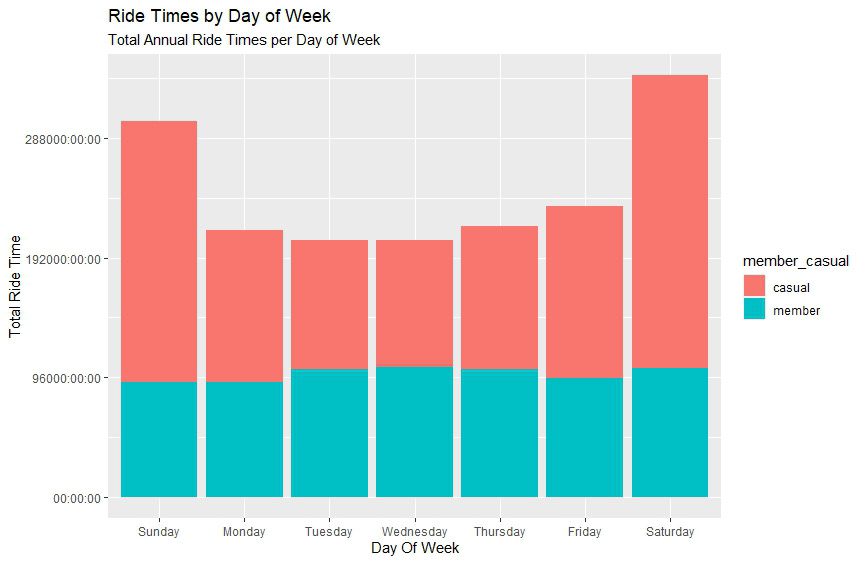
With this viz we can see that for casuals there are spikes in ride time during the weekend, spanning from Friday to Sunday, with low points throughout the middle of the week. However, for members, their ride times by day are much more stable throughout the week with slight variations during the weekend. This would indicate that members rely on and use these bikes as their everyday transport, whereas casuals use these bikes for leisure.
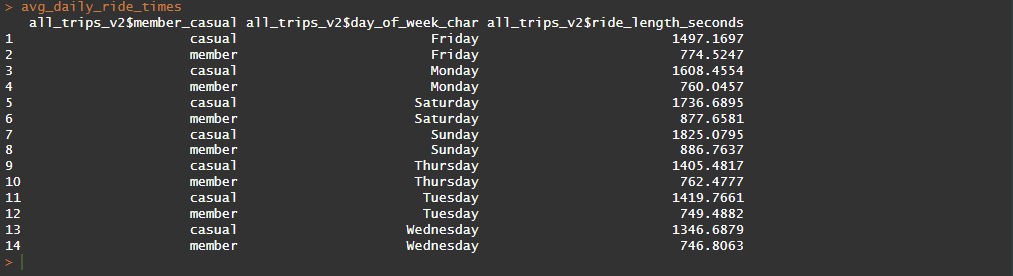
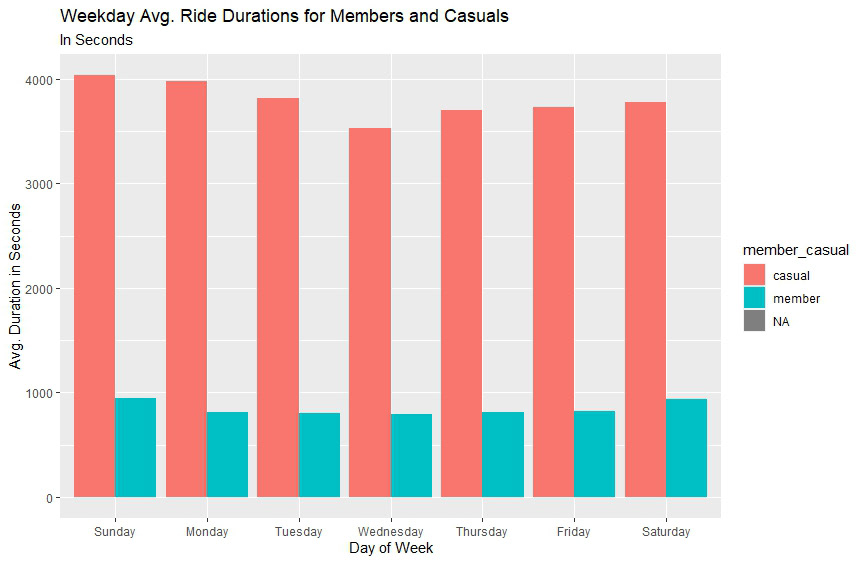
Instead of looking at total ride times this viz will show weekday average ride times for each group. Similar to the total ride times we see that on average casuals spend more time riding on the weekends with the mid-week dips and the members' average ride times are similar and much more stable throughout the week.
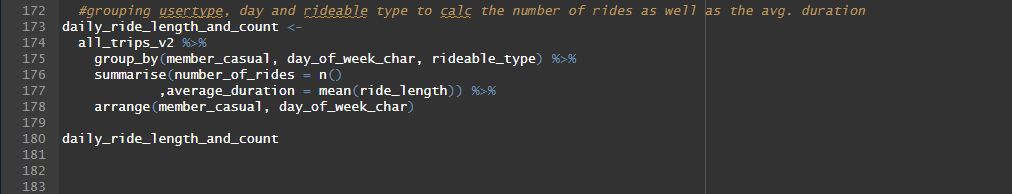
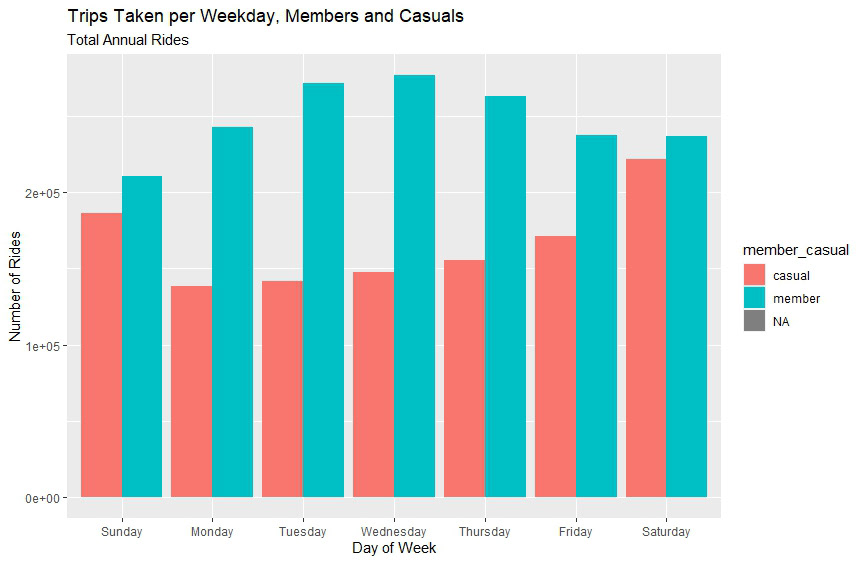
Now that we know what total and average ride times for each group looks like throughout a given week, this graph will show the number of trips taken for each group throughout the week. We can see that for casuals there is a steady increase from Monday to the end of the week in regards to the number of rides. This tells us that even though we saw a dip for this group midweek when looking at ride durations it does not necessarily mean a dip in activity, rather casuals are taking more trips just with shorter durations. Now looking at members. In the previous graphs of ride duration, we saw that this group was relatively stable throughout the week with little variation, but when looking at the number of trips taken we can see that members are tending to ride more frequently during the middle of the week than during the weekends. This could be the result of what I mentioned previously with casuals possibly riding for leisure where members ride out of necessity, where riders are taking more trips going to and from their workplaces, grocery stores, etc. with the lull in the weekends showing that these riders are not having to ride as much.
_______________________________________________________________________
Act
Your top high-level insights based on your analysis
Recommendations
In order to convert more casuals over to Cyclistic’s membership program there are a few things we could do. Looking at our data there were quite a few differences between the casual and member groups that could help us target and market to our casual group. The differences were
1) Casuals generally took fewer, but longer trips than members.
2) Casuals preferred electric bikes over the classic bikes, and was the only group to use our docked bikes. With the smaller segment of casuals riding classic bikes. longer than their counterparts on electric bikes.
3) Ride durations in total and on average for casuals peaked during the weekends.
4) Number of trips taken by casuals steadily increase from the beginning of the week to the weekend, with the peak number of trips taken during the weekend.
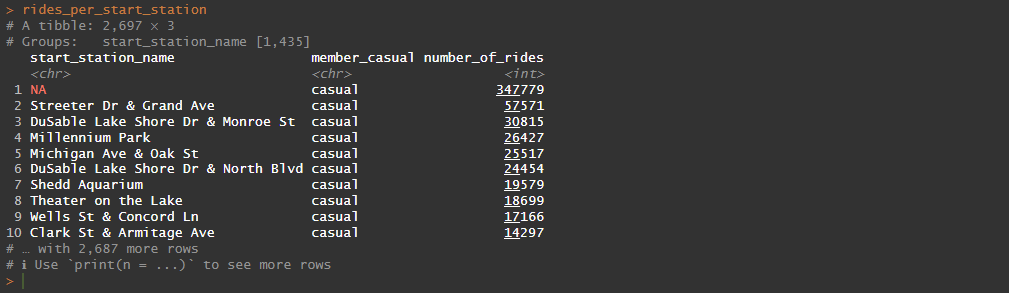
With these differences, we could assume that casual riders are using our bikes for leisure rather than necessity, compared to our members. To convert casuals over to members we could offer membership plans that target our casuals preferences. Since casuals take fewer but longer trips, rather than promoting plans that are cheaper and based on the number of rides, we could base discounts on ride times instead, targeting their longer ride duration tendencies. We could also offer incentives based on their bike preference which they could gain from the membership based on what type of bike they choose to ride. Another plan we could offer is rather than convert our casuals to a standard annual membership plan, Cyclistic could generate a new weekend (Friday - Sunday) membership plan at a lower price since this is when casuals prefer to ride. With any of these plans, we could start our marketing campaign at the top 10 most used start stations by our casuals to gain awareness.
Wrap up
With these recommendations focusing on Cyclistic’s casual group, the company could gear its marketing campaign towards the preferences of our casual group as discussed and use the most frequented start stations to run ad campaigns in order to inform and raise awareness of this group and convert casuals over to our membership plans.
Thank You for taking the time to go through my case study!
-Harrison Arthur